Maternal Health Risk Analysis
Project Information
- Category: Healthcare Analytics / Data Visualization
- Client: Personal Project
- Project Date: November 2023
- Tools Used: Tableau, Microsoft Excel
- Data Source: IoT-based risk monitoring system data from hospitals, community clinics, and maternal health cares.
- Project URL: View on Tableau Public
Maternal Health Risk Analysis
---Summary
I undertook a project focused on Maternal Health Risk Analysis using Tableau. The primary objective was to predict health risks for pregnant patients by analyzing data collected from an IoT-based risk monitoring system. This project involved transforming raw sensor data into actionable insights, identifying key health indicators that strongly correlate with high-risk pregnancies, and developing intuitive visualizations to empower healthcare providers in making timely and informed decisions. The goal was to contribute to improved maternal healthcare outcomes by enabling early risk identification and preventative care strategies.
---1. Introduction: The Challenge of Maternal Health Risk
Maternal health remains a critical global health concern, with significant challenges in identifying and managing risks during pregnancy. Timely identification of potential complications is paramount for ensuring the well-being of both mother and child. This project addresses this challenge by leveraging an IoT-based risk monitoring system dataset. The aim was to apply data analysis and visualization techniques to understand the underlying factors contributing to maternal health risks and to develop a predictive understanding of patient health status.
The project sought to answer a crucial question: "Which health conditions are the strongest indications for health risks during pregnancy?" By dissecting the provided dataset, I aimed to provide a clear, data-driven answer that could support healthcare professionals.
---2. Project Objectives & Goals
My work on this project was guided by clear objectives to deliver impactful insights:
Overall Objectives:
- To analyze and predict the Risk Intensity Level (Low, Mid, High) for pregnant patients based on physiological data.
- To identify the most influential health conditions and physiological parameters that strongly indicate maternal health risks.
- To create an intuitive and interactive Tableau dashboard to visualize risk factors and their impact.
Project Goals & Deliverables:
- Risk Level Distribution Visualization: A clear representation of the distribution of Low, Mid, and High-risk pregnancies within the dataset, providing an immediate understanding of the overall risk landscape.
- Key Risk Factor Identification: Visualizations that highlight which attributes (e.g., Blood Pressure, Blood Glucose, Heart Rate) are most strongly associated with higher risk levels. This included analyzing averages and distributions across risk categories.
- Age-Related Risk Assessment: An analysis of how maternal age influences the risk level and the manifestation of various health conditions, potentially identifying age groups with elevated vulnerabilities.
- Physiological Parameter Correlation: Exploring the relationships between different physiological parameters (e.g., Systolic BP vs. Diastolic BP, or Heart Rate vs. Risk Level) to uncover intertwined health indicators.
- Interactive Tableau Dashboard: A user-friendly dashboard enabling healthcare practitioners to filter data, drill down into specific patient profiles or risk factors, and gain a holistic view of maternal health risks.
3. Data Scope & Metrics
The project utilized a rich dataset collected from various healthcare facilities through an IoT-based risk monitoring system. The dataset includes the following critical attributes:
- Age: Age of the pregnant woman in years.
- SystolicBP: Upper value of Blood Pressure in mmHg.
- DiastolicBP: Lower value of Blood Pressure in mmHg.
- BS (Blood Sugar): Blood glucose levels in mmol/L.
- HeartRate: Resting heart rate in beats per minute.
- BodyTemperature: Body temperature in degrees Celsius (though not explicitly listed in your prompt, it's often part of such datasets and useful for insights, if available).
- Risk Level: The predicted risk intensity level during pregnancy (Low Risk, Mid Risk, High Risk) – this was the target variable for prediction.
Key Insights Derived from Data:
- Blood Pressure as a Strong Indicator: My analysis revealed that SystolicBP and DiastolicBP were consistently strong indicators of risk. Patients with elevated blood pressure readings frequently fell into Mid or High-risk categories, underscoring the importance of blood pressure monitoring.
- Blood Glucose (BS) Impact: Uncontrolled blood glucose levels also showed a clear correlation with increased risk. Patients with higher BS values were more likely to be classified as high-risk, suggesting the significance of managing gestational diabetes or pre-existing diabetes.
- Age and Risk Interplay: While age itself might not be a direct risk factor, the analysis showed that specific health conditions (like high BP or BS) tended to be more prevalent in certain age groups, indirectly elevating their risk. For example, older mothers might have a higher predisposition to certain conditions.
- Combined Effect of Indicators: The dashboard allowed for the observation that a combination of moderately elevated readings across several parameters (e.g., slightly high BP, slightly elevated BS, and slightly irregular heart rate) could cumulatively push a patient into a higher risk category, even if no single parameter was critically high.
4. Dashboard Design & Key Insights
My Tableau dashboard was designed for clarity and actionable insights, enabling healthcare professionals to quickly assess a patient's risk profile. Key components included:
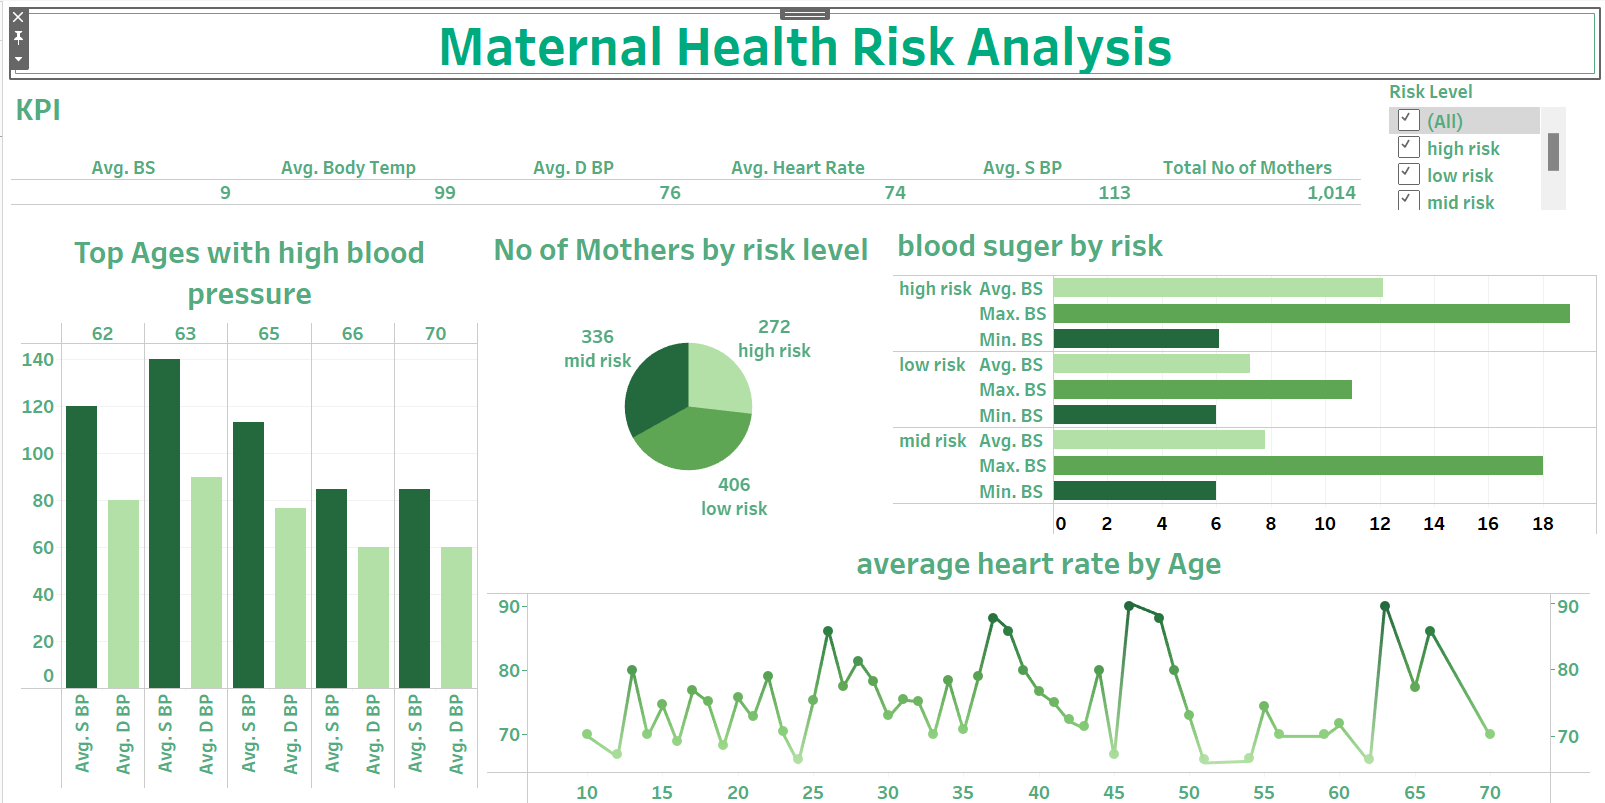
Dashboard Features and Insights:
- Risk Level Summary: A clear bar chart or pie chart displaying the overall proportion of Low, Mid, and High-risk patients, providing an immediate snapshot of the dataset's risk distribution.
- Parameter-wise Risk Analysis: Individual charts (e.g., box plots or histograms) for each key health parameter (Age, Systolic BP, Diastolic BP, BS, Heart Rate), segmented by 'Risk Level'. This allowed for visual identification of the typical ranges of these parameters within each risk category. For example, higher median SystolicBP values were observed in High-risk groups.
- Scatter Plots for Correlations: Using scatter plots to visualize the relationship between two parameters (e.g., Systolic BP vs. Diastolic BP, or Age vs. HeartRate), with data points colored by 'Risk Level'. This helped in identifying clusters of high-risk patients based on multiple parameters.
- Interactive Filters: Filters for each health attribute and the 'Risk Level' itself, allowing users to drill down. For instance, a user could filter for patients with a Systolic BP above a certain threshold and observe their corresponding Risk Level distribution.
- "Strongest Indications" Visualizations: Dedicated sections or charts were developed to directly address the "strongest indications" question. This might involve a bar chart showing the average value of each health parameter per risk level, or a trellis chart demonstrating the distribution of each parameter across different risk categories, making the most impactful indicators visually apparent.
The dashboard's interactive nature allows for exploratory analysis, enabling users to hypothesize and validate which specific health conditions, or combinations thereof, lead to higher maternal health risks.
---5. Technical Approach & Tools
This project followed a standard data analysis and visualization pipeline:
- Data Acquisition: The dataset was collected from an IoT-based risk monitoring system across various healthcare touchpoints.
- Data Cleaning & Preprocessing (Microsoft Excel): Before visualization, the raw data underwent thorough cleaning in Microsoft Excel. This included handling any inconsistencies, checking for missing values, and ensuring data types were appropriate for analysis.
- Exploratory Data Analysis (EDA): Initial statistical summaries and basic visualizations were performed to understand data distributions, identify outliers, and form preliminary hypotheses about relationships between health parameters and risk levels.
- Data Visualization & Dashboarding (Tableau): The core of the project's delivery was built using Tableau Desktop. This involved:
- Connecting to the prepared dataset.
- Creating various sheets with different chart types (e.g., histograms, bar charts, scatter plots) to visualize the impact of each health parameter on the 'Risk Level'.
- Developing calculated fields to categorize or transform data as needed for specific insights.
- Assembling multiple sheets into a cohesive, interactive dashboard, ensuring logical flow and user-friendliness.
- Publishing the final dashboard to Tableau Public for easy access and sharing.
6. Impact & Business Value
This Maternal Health Risk Analysis project offers substantial value, particularly within a clinical or public health context:
- Early Risk Identification: The primary impact is enabling the early identification of pregnant patients who are at a higher risk of complications. This allows for proactive intervention and specialized care.
- Resource Optimization: By understanding the prevalence of different risk levels and the contributing factors, healthcare resources (e.g., specialized clinics, medical personnel) can be allocated more efficiently to where they are most needed.
- Enhanced Patient Outcomes: Timely identification and management of risks can significantly reduce maternal and infant morbidity and mortality rates, leading to healthier pregnancies and deliveries.
- Data-Driven Clinical Decision Support: The dashboard provides a visual tool that supports clinicians in assessing individual patient risks based on objective data, moving beyond subjective assessments.
- Targeted Public Health Programs: Insights gained can inform public health campaigns, focusing on specific health conditions or demographic groups that show higher vulnerability, thereby improving overall community health.
- Contribution to IoT in Healthcare: This project showcases the practical application of IoT-collected health data in a real-world scenario, demonstrating its potential for continuous patient monitoring and risk prediction in maternal healthcare.
7. Conclusion
My Maternal Health Risk Analysis project successfully leveraged an IoT-based dataset and Tableau to provide critical insights into predicting health risks for pregnant patients. By clearly identifying the strongest indications for health risks—particularly around blood pressure, blood glucose, and atypical heart rates, often in combination—this project demonstrates my ability to clean, analyze, and visualize complex healthcare data. The interactive Tableau dashboard serves as a powerful tool for healthcare professionals, enabling data-driven decision-making that can lead to improved maternal health outcomes and more targeted preventative strategies. This experience solidified my skills in data visualization and healthcare analytics within a real-world setting.